



 Tre'VonSpillersJr
 DonovanGregorySr
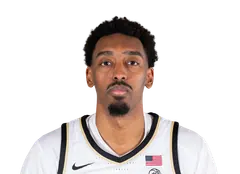 JustinAbsonSo
 XavionBrownJr
 MylesTateSr
 CJHuntleySr
 TerenceHarcumJrCMChristopherMantisJr
BGBryantGreeneSr
DFDawsonFennemaSo
 JordanMarshFrJHJoshHayesFr
 LukeLedfordFr
| T. SpillersTre'Von Spillers | Jr | 6'7" | +2.793 | 1.495 | +8.882 | 62.3%81 | 18.5%54 | 12.8 | 8.9 | 0.4 | 0.0% | 68.6% |
| D. GregoryDonovan Gregory | Sr | 6'3" | +2.390 | 1.292 | +5.671 | 56.5%60 | 23.8%84 | 13.1 | 4.4 | 3.1 | 46.7% | 78.2% |
| J. AbsonJustin Abson | So | 6'9" | +2.188 | 0.988 | +4.165 | 61.2%79 | 17.0%43 | 7.9 | 7.1 | 1.4 | 12.5% | 47.1% |
| X. BrownXavion Brown | Jr | 6'3" | +1.884 | 0.580 | +9.383 | 50.6%31 | 15.7%35 | 3.4 | 3.4 | 2.3 | 0.0% | 38.2% |
| M. TateMyles Tate | Sr | 6'0" | +1.379 | 0.581 | -1.438 | 51.6%35 | 23.8%84 | 9.4 | 3.2 | 3.5 | 29.4% | 74.7% |
| CJ Huntley | Sr | 6'11" | +0.668 | 0.271 | -8.015 | 64.9%87 | 15.6%34 | 7.5 | 4.6 | 0.8 | 34.6% | 68.1% |
| T. HarcumTerence Harcum | Jr | 6'3" | +0.362 | 0.266 | +0.045 | 51.1%33 | 20.4%67 | 12.0 | 2.5 | 1.0 | 35.8% | 81.7% |
| C. MantisChristopher Mantis | Jr | 6'7" | +0.158 | 0.058 | -9.012 | 51.0%32 | 15.4%33 | 5.3 | 2.0 | 0.7 | 31.8% | 57.1% |
| B. GreeneBryant Greene | Sr | 6'1" | – | – | – | – | 17.8%49 | 2.1 | 1.1 | 0.9 | 0.0% | 0.0% |
| D. FennemaDawson Fennema | So | 6'2" | – | – | – | – | 0.0%1 | 1.2 | 0.2 | 0.2 | 0.0% | 0.0% |
| J. MarshJordan Marsh | Fr | 5'10" | – | – | – | 51.4%34 | 29.8%97 | 6.2 | 1.6 | 1.3 | 29.8% | 71.4% |
| J. HayesJosh Hayes | Fr | 6'9" | – | – | – | – | 16.3%39 | 3.8 | 2.6 | 0.3 | 0.0% | 100.0% |
| L. LedfordLuke Ledford | Fr | 6'3" | – | – | – | – | 0.0%1 | 0.8 | 0.2 | 0.0 | 0.0% | 0.0% |